Midterm years have often been bumpy for stocks. The year after has historically been far more rewarding.
On November 3, voters will head to the polls for the 2026 midterm elections. As Election Day gets closer, many investors start asking a familiar question: should I do something with my portfolio before the votes are counted?
History offers a useful starting point. Below, we look at what the record shows about midterm years, what it cannot tell us, and how we think about elections inside a rules-based process.
Midterm years have historically been the bumpy part of the cycle
Markets tend to dislike uncertainty, and midterm years bring plenty of it. Policy debates heat up, campaign messaging gets louder, and investors wait months to learn the makeup of the next Congress.
The data reflects that. According to LPL Research, in midterm years the S&P 500 has averaged a 17.5% drawdown before a strong post-election rebound.1 Capital Group found that since 1970, midterm years have had a median volatility of nearly 16%, compared with 13% in all other years, with volatility especially elevated in the weeks leading up to the election.2 Full-year results have also lagged. Going back to 1930, S&P 500 total returns have averaged 4.7% in midterm years, well below the 9.5% average for non-midterm years.2
In other words, a meaningful pullback during a midterm year has been a common part of the pattern. On its own, it has not been a reliable signal that something is wrong.
The year after has told a different story
For long-term investors, what happens after Election Day matters more, and here the record has been encouraging. BNY Investments looked at every midterm election since 1950 and found that the S&P 500 posted a positive price return in the 12 months that followed each one, with an average gain of 16.6%.3 Capital Group, measuring a slightly different window, put the average one-year return after a midterm at 15.4% since 1950.2
We believe part of the explanation is simple. Once the votes are counted, a major source of uncertainty falls away, and investors can turn their attention back to earnings, interest rates, and the economy.
A word of caution belongs here, too. Nineteen elections is a small sample, and a historical streak is no guarantee. Valuations, the economy, and Federal Reserve policy all shape returns, and every cycle is different.
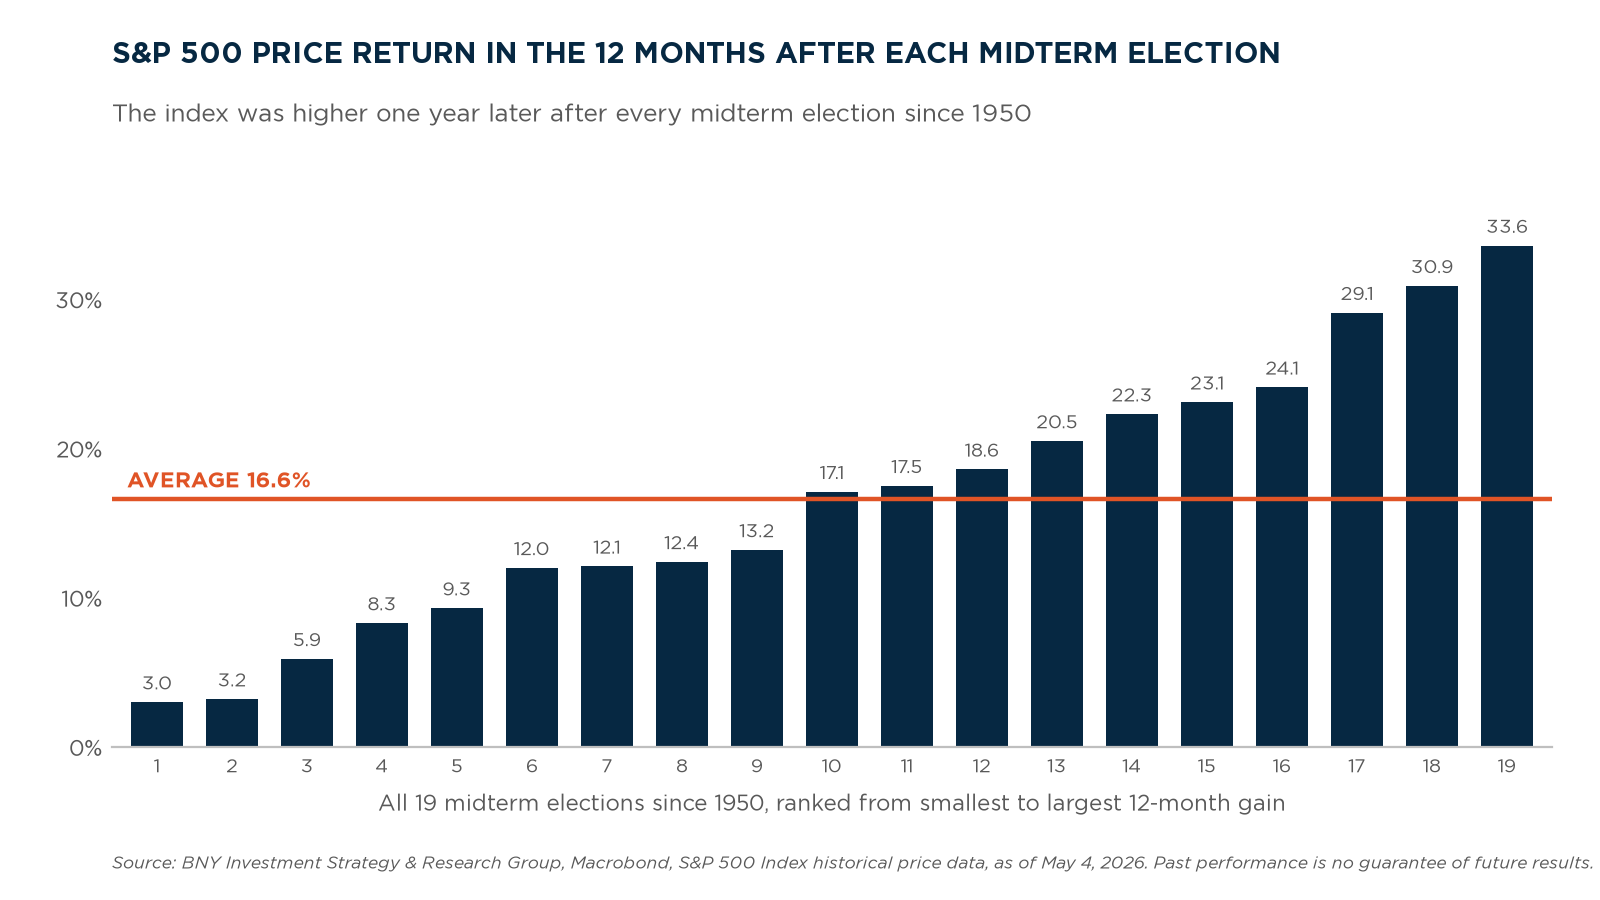
Midterm elections at a glance
| MEASURE | FIGURE | SOURCE |
|---|---|---|
| Average S&P 500 drawdown in midterm years | 17.5% | LPL Research1 |
| Median volatility since 1970: midterm years vs. all other years | Nearly 16% vs. 13% | Capital Group2 |
| Average S&P 500 total return since 1930: midterm years vs. non-midterm years | 4.7% vs. 9.5% | Capital Group2 |
| Average S&P 500 price return in the 12 months after a midterm election, since 1950 | 16.6% | BNY Investments3 |
| Midterm elections since 1950 followed by a positive 12-month S&P 500 return | 19 of 19 | BNY Investments3 |
Past performance is no guarantee of future results. Figures come from different studies with different time periods and methods, as noted in Sources.
The outcome has mattered less than many expect
It is natural for clients to wonder whether the result itself will move their portfolio. History suggests it has mattered less than many people assume. Capital Group notes that going back to 1933, markets have averaged double-digit returns under a range of government-control scenarios, and that elections have historically had little impact on long-term investment returns.2 BNY reached a similar conclusion, finding that once the outcome was known, the market often rallied regardless of the results.3
Policy can certainly affect individual industries. Over full market cycles, though, we believe earnings, interest rates, and economic growth have done far more to drive stock prices than the balance of power in Washington.
Process over prediction
At CooksonPeirce, we do not position portfolios around a forecast of who will win. Our process has been rules-based since 1984. Every stock in our universe is scored weekly against the same set of momentum and fundamental factors. Our buy discipline starts with momentum, then looks at fundamentals (quality, value, and growth), and our sell discipline is mechanical and emotion-free.
That consistency matters in a year like this one. If election uncertainty shifts market leadership, those changes may show up in the factors we track, and the portfolio can adjust the way it always does. If the market looks past the headlines, the same rules apply. Before and after Election Day, every decision traces back to the evidence in front of us.
A practical takeaway for client conversations
Midterm season is a good time to set expectations before the headlines get louder. A few points we believe can help:
- Volatility before a midterm is familiar territory: A pullback in a midterm year has historically been part of the normal pattern, with an average drawdown of 17.5%.1
- The year after has been constructive: The S&P 500 has posted a positive 12-month return after every midterm election since 1950, although past results do not guarantee future ones.3
- The result has mattered less than expected: Markets have historically produced solid returns under many different combinations of party control.2
- A plan beats a prediction: Selling ahead of an election means getting two calls right, when to get out and when to get back in. A plan built around long-term goals removes the need to make either call.
Elections will come and go. We believe a disciplined, repeatable process gives clients something steadier to rely on than a forecast, in midterm years and every year in between.
Key terms
- Midterm election: The US federal election held halfway through a president’s four-year term. All 435 seats in the House of Representatives and about one-third of Senate seats are on the ballot.
- S&P 500 Index: An index of 500 large US companies that is widely used as a measure of the overall US stock market.
- Drawdown: The decline in an investment or index from a peak to a later low, shown as a percentage.
- Pullback: A temporary decline in stock prices during a longer-term trend.
- Rebound: A recovery in prices after a decline.
- Volatility: How much and how quickly prices move up and down. Higher volatility means larger swings.
- Standard deviation: A statistical measure of how widely returns vary from their average. It is a common way to measure volatility.
- Median: The middle value in a set of numbers when they are lined up from lowest to highest.
- Total return: The change in price plus any dividends received.
- Price return: The change in price only, without dividends.
- Presidential cycle: The four-year span of a presidential term. The second year of each term is the midterm year.
- Government-control scenarios: The different ways the White House, the House, and the Senate can be split between the two major parties.
- Valuations: How expensive stocks are relative to measures such as company earnings.
- Rules-based process: An investment approach that follows a fixed, written set of rules, applied the same way every time.
- Momentum: The tendency of stocks that have been rising to keep rising for a period of time. Momentum investing looks for stocks with strong recent price trends.
- Fundamental factors: Measures drawn from a company’s business and financial results. Quality looks at financial strength and profitability, value looks at how a stock is priced relative to its fundamentals, and growth looks at how quickly sales and earnings are increasing.
- Market leadership: The sectors, industries, or styles of stocks that are performing best at a given time.
- Sell discipline: The set of rules that decides when an investment is sold.
Sources
1 LPL Research, Weekly Market Commentary, December 1, 2025. https://www.lpl.com/content/dam/edam/series/weekly-market-commentary/outlook-sneak-peek-weekly-market-commentary-12-01-25.pdf
2 Matt Miller and Chris Buchbinder, “How US midterm elections affect the markets,” Capital Group, Capital Ideas, January 26, 2026. Data: Capital Group, RIMES, Standard & Poor’s. Midterm and non-midterm year figures are S&P 500 Index total returns going back to 1930, as of January 15, 2026. Volatility is the median standard deviation of daily returns for each month, since 1970, as of December 31, 2025. One-year returns after midterm elections are S&P 500 Index price returns measured from Election Day, 1950 to 2023, as of January 15, 2026. https://www.capitalgroup.com/apac/capitalideas/en/articles/how-us-midterm-elections-affect-the-markets.html
3 BNY Investments, “How Do Midterm Elections Impact Markets Over Time?,” May 2026. Data: BNY Investment Strategy & Research Group, Macrobond, S&P 500 Index historical price data, 12-month price returns following each US midterm election from 1950 through 2022, as of May 4, 2026. https://www.bny.com/content/dam/im/im-na/articles/pdf/how-do-midterm-elections-impact-markets-over-time.pdf
Chart: BNY Investments, “How Do Midterm Elections Impact Markets Over Time?,” May 2026. Data: BNY Investment Strategy & Research Group, Macrobond, S&P 500 Index historical price data, as of May 4, 2026.
Important Disclosures
Investing involves risk, including possible loss of principal. Investment decisions are subject to market, currency, economic, and business risks and will not always be profitable. There is no guarantee that risk can be successfully mitigated or otherwise avoided.
Past performance is no guarantee of future results.
Nothing discussed in this material should be considered an offer to buy or suggestion to sell securities.
Statements using “if,” “may,” “can,” “should,” “will” or similar may be forward looking and are not intended as an opinion, projection, or estimate regarding the market, CooksonPeirce, or its products.
Cookson Peirce & Co., Inc. is an SEC registered investment adviser. Registration does not imply a certain level of skill or training. See Form ADV at adviserinfo.sec.gov.
The views expressed are those of the CooksonPeirce Investment Management team as of October 2026 and are subject to change without notice. This material is for informational purposes only, does not predict or endorse any election outcome, and is not a recommendation to buy or sell any security.
The S&P 500 Index is an unmanaged index of 500 large US companies and is widely used as a measure of the US stock market. Index returns do not reflect fees or expenses. An investor cannot invest directly in an index.
Risk Disclosures
Market Risk. The price of a security, bond, or mutual fund may drop in reaction to tangible and intangible events and conditions. This type of risk is caused by external factors independent of a security’s particular underlying circumstances. For example, political, economic, and social conditions may trigger market events.
Equity (Stock) Risks. Common stocks are subject to general stock market fluctuations and to volatile increases and decreases in value as market confidence and perception of their issuers change. There is also a certain level of company or industry specific risk that is inherent in each investment. There is the risk that the company will perform poorly or have its value reduced based on factors specific to the company or its industry.
About CooksonPeirce
CooksonPeirce is a Pittsburgh-based, 100% employee-owned registered investment adviser founded in 1984, with more than $3 billion in assets under management.